AI Servo Monitor
Share
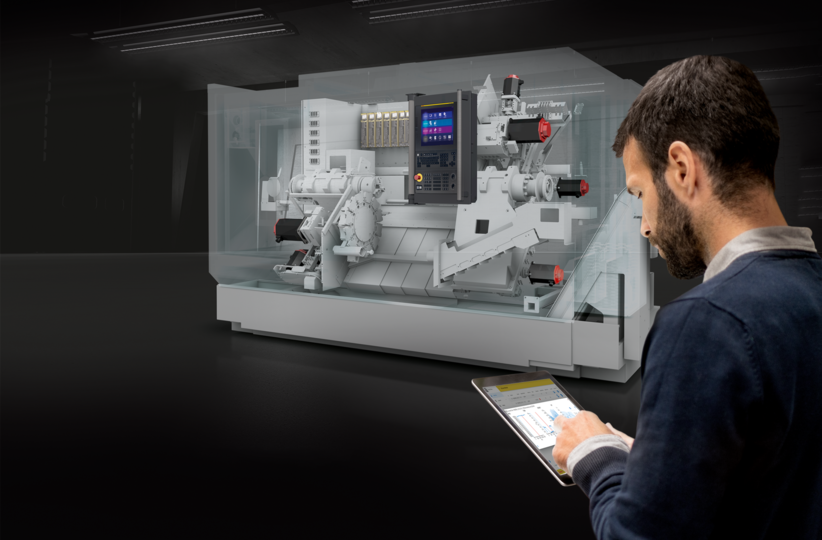
AI Servo Monitor is a software that visualises anomalies of drive systems for servos and spindles through machine learning. It can analyse daily processing data and display the results in intuitive graphs. Users can easily monitor abnormalities on the machine, that is equipped with a FANUC CNC. AI Servo Monitor analyses the recorded production data of each drive system.
KEY BENEFITS
Benefits for Your Business

Improve Uptime
Better uptime for milling, turning and grinding machines with FANUC CNC.

Improve Productivity
Productivity improvement by better planning of maintenance activities.

Reduce Costs
Cost reduction by early issue detection.
KEY FEATURES
Features Designed for Your Success

Condition monitoring of mechanical elements of axes and spindles.

No need for additional sensors as data comes directly from the machine servo motor allowing a failure prediction system to be easily created.

Monitoring of the anomaly score in intuitive graphs (Web UI).

Automatic creation of a baseline model through machine learning while the machine is in production.
FUNCTIONALITIES
Main Functionalities of AI Servo Monitor
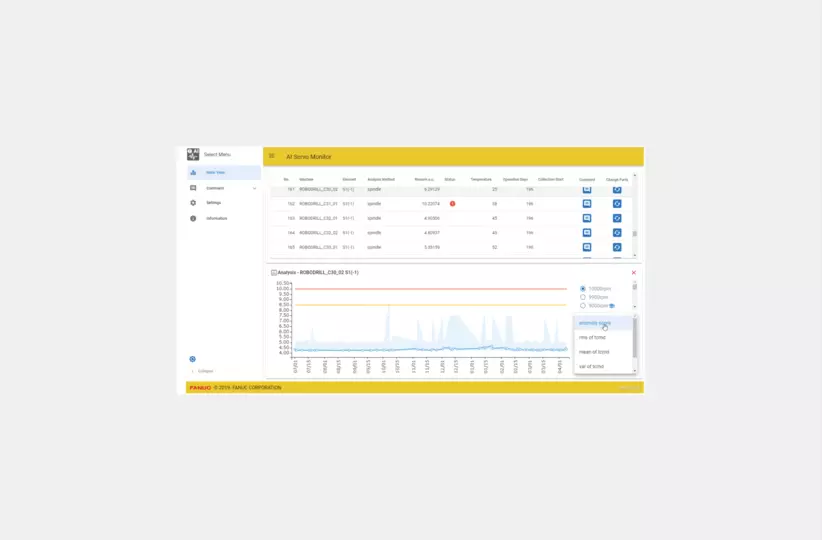
Main View
The result of analysed waveform data using anomaly and variance detection are displayed. The graphical interface shows the aggregated analysis result and values for each day.
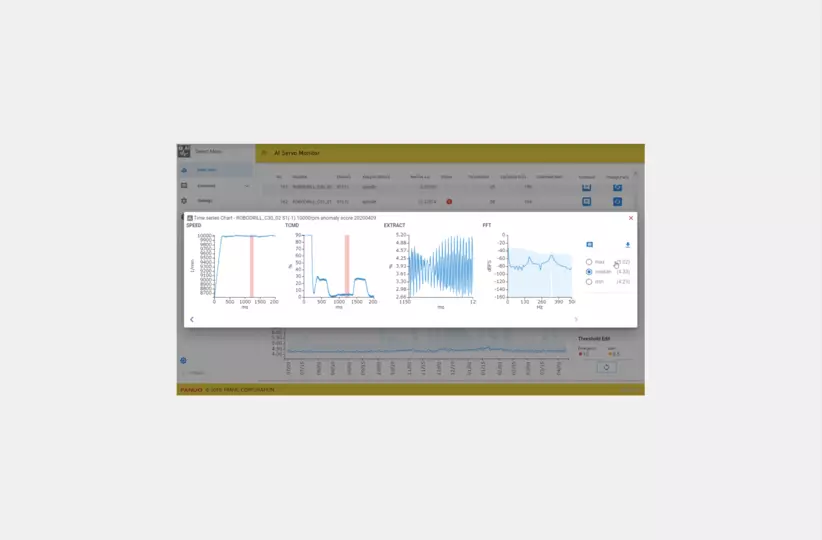
Raw Data Chart Text
The raw data chart shows the waveform of the collected data used for the analysis. Not only raw data but also the individual spectral components of the measured torque signal are displayed in an FFT diagram.
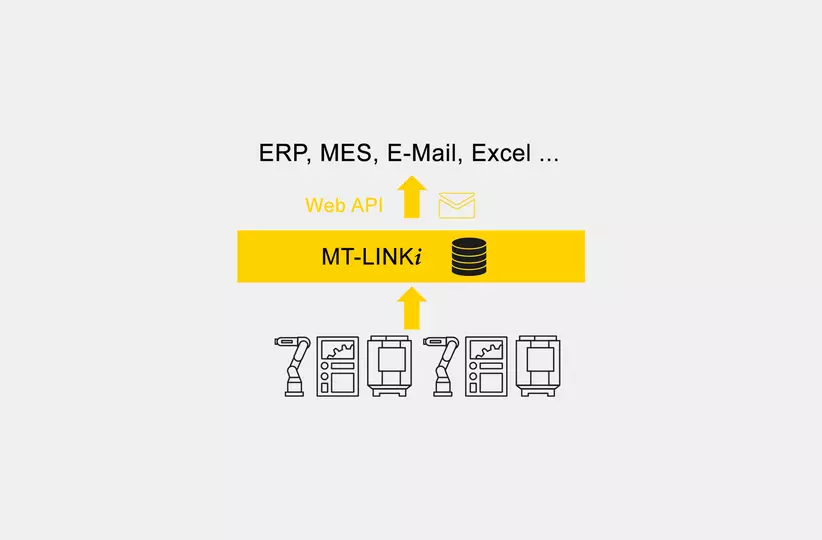
Connectivity
Analysis results can easily be gathered by other software solutions through the Web API. In addition users can be notified automatically by the E-Mail notification function in case the anomaly score crosses a certain level.
DOCUMENTS